Data Curated and Edited by Subhajit Ganguly.
Click on the Respective Image to
Get Larger View
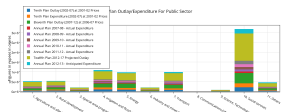
Plan Outlay/Expenditure For Public Sector By Heads Of Development – State and Union Territory Governments
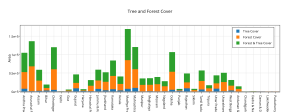
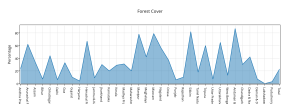
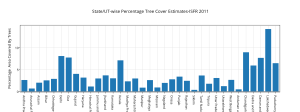
Tree and Forest Cover
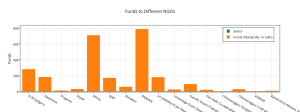
Funds Alloted to Different NGOs
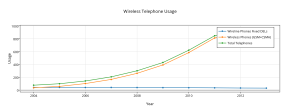
Wireless Telephone Usage
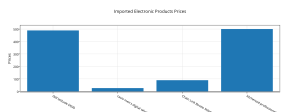
Imported Electronic Products Prices
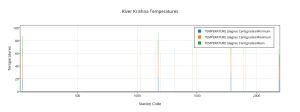
River Krishna Temperatures
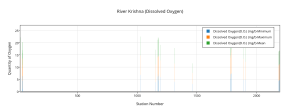
River Krishna (Dissolved Oxygen)
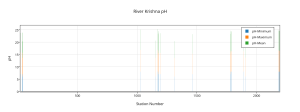
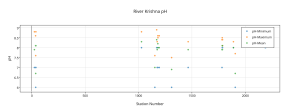
River Krishna pH
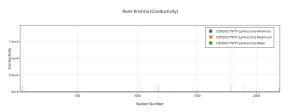
River Krishna (Conductivity)
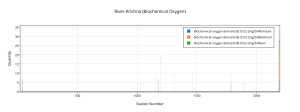
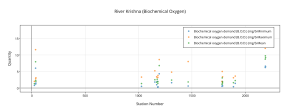
River Krishna (Biochemical Oxygen)
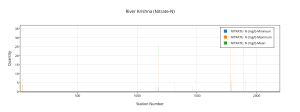
River Krishna (Nitrate-N)
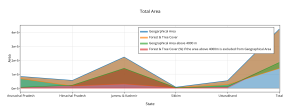
Total Area Usage of a Few States
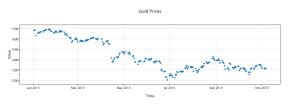
Gold Prices
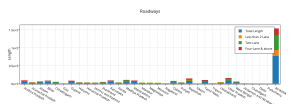
State-wise length of National Highways
Forest Cover Percentages
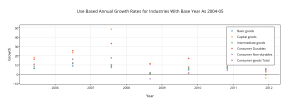
Use Based Annual Growth Rates of all India Index of Industrial Production (Base: 2004-05 = 100) from 2005-06 to 2012-13
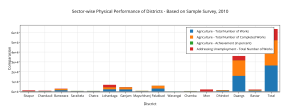
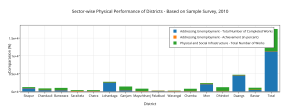
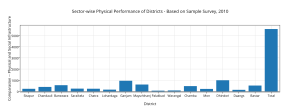
Sector-wise Physical Performance of Districts – Based on Sample Survey, 2010 ‘Evaluation Study on Rashtriya Sam Vikas Yojna (RSVY), 2010’
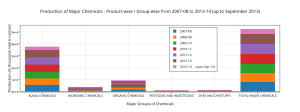
Production of Major Chemicals – Product-wise / Group-wise from 2007-08 to 2013-14 (up to September 2013)
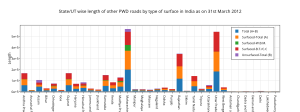
State/UT wise length of other PWD roads by type of surface in India as on 31st March 2012
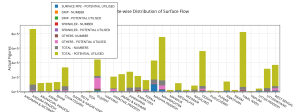
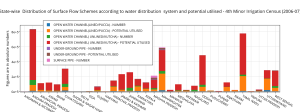
State-wise Distribution of Surface Flow Schemes according to water distribution system and potential utilised – 4th Minor Irrigation Census (2006-07)
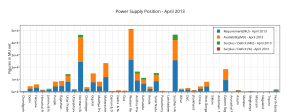
Power Supply Position – April 2013
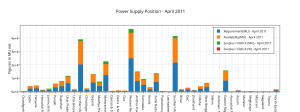
Power Supply Position – April 2011
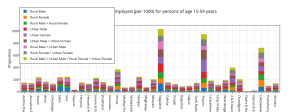
Proportion Unemployed (per 1000) for persons of age 15-59 years according to usual status (taking both principal and subsidiary status together) for each State/UT
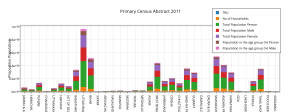
Primary Census Abstract 2011 – India and States
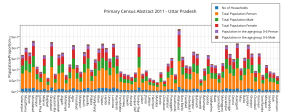
Primary Census Abstract 2011 – Uttar Pradesh
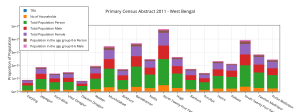
Primary Census Abstract 2011 – West Bengal
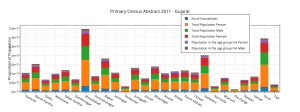
Primary Census Abstract 2011 – Gujarat
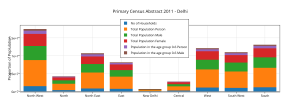
Primary Census Abstract 2011 – Delhi
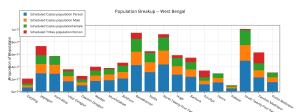
Population Breakup — West Bengal
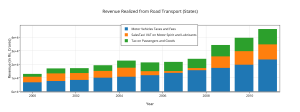
Revenue Realized from Road Transport (States)
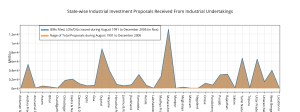
State-wise Industrial Investment Proposals Received From Industrial Undertakings
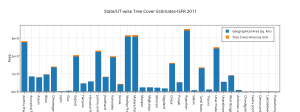
State/UT-wise Tree Cover Estimates-ISFR 2011
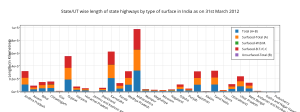
State/UT wise length of state highways by type of surface in India as on 31st March 2012
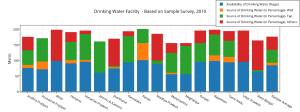
Drinking Water Facility and Source of Water – Based on Sample Survey, 2010
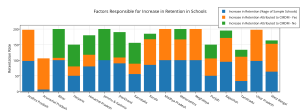
Factors Responsible for Increase in Retention in Schools — Based on Sample Survey, 2010
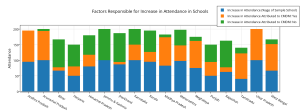
Factors Responsible for Increase in Attendance in Schools
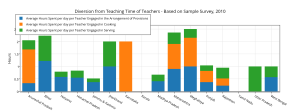
Diversion from Teaching Time of Teachers – Based on Sample Survey, 2010
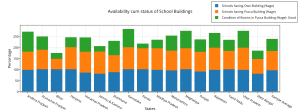
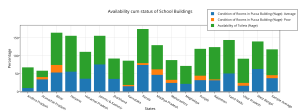
Availability cum status of School Buildings – Based on Sample Survey
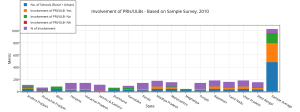
Involvement of PRIs/ULBs – Based on Sample Survey, 2010
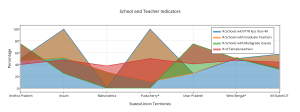
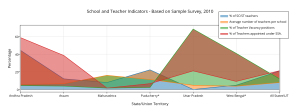
School and Teacher Indicators – Based on Sample Survey, 2010
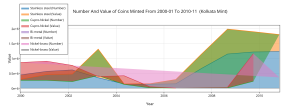
Number And Value of Coins Minted From 2000-01 To 2010-11 (Kolkata Mint)
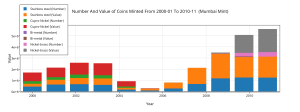
Number And Value of Coins Minted From 2000-01 To 2010-11 (Mumbai Mint)
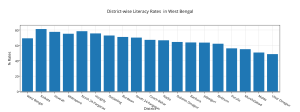
District-wise Literacy Rates in West Bengal
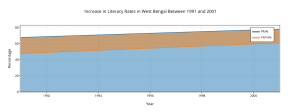
Increase in Literacy Rates in West Bengal Between 1991 and 2001
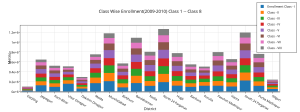
Class Wise Enrollment(2009-2010) Class 1 — Class 8
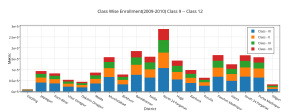
Class Wise Enrollment(2009-2010) Class 9 — Class 12
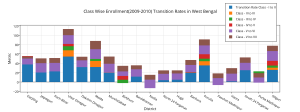
Class Wise Enrollment(2009-2010) Transition Rates in West Bengal
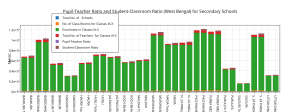
Pupil-Teacher Ratio and Student-Classroom Ratio (West Bengal) for Secondary Schools
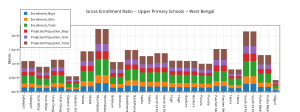
Gross Enrollment Ratio — Upper Primary Schools — West Bengal
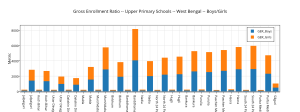
Gross Enrollment Ratio — Upper Primary Schools — West Bengal — Boys/Girls
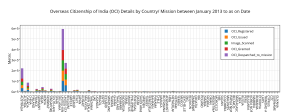
Overseas Citizenship of India (OCI) Details by Country/ Mission between January 2013 to as on Date
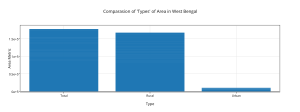
Comparasion of ‘Types’ of Area in West Bengal
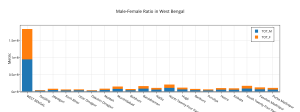
Male-Female Ratio in West Bengal
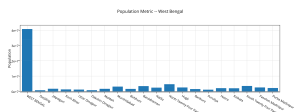
Population Metric — West Bengal
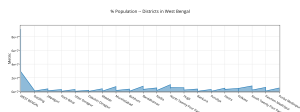
% Population — Districts in West Bengal
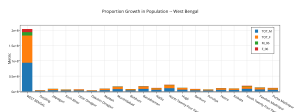
Proportion Growth in Population — West Bengal
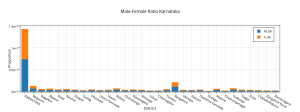
Male-Female Ratio Karnataka
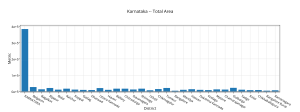
Karnataka — Total Area
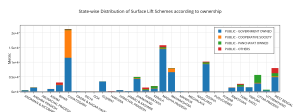
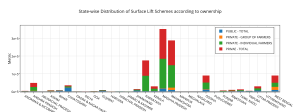
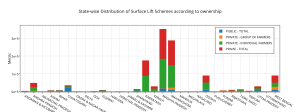
State-wise Distribution of Surface Lift Schemes according to ownership
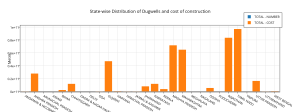
State-wise Distribution of Dugwells and cost of construction
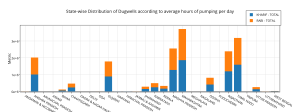
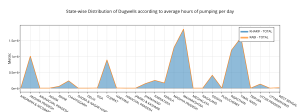
State-wise Distribution of Dugwells according to average hours of pumping per day
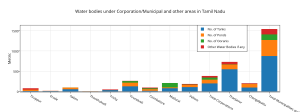
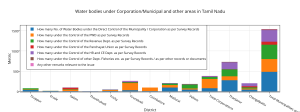
Water bodies under Corporation/Municipal and other areas in Tamil Nadu
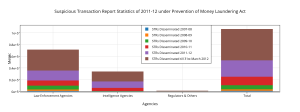
Suspicious Transaction Report Statistics of 2011-12 under Prevention of Money Laundering Act
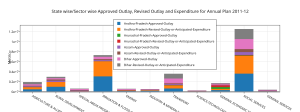
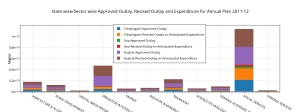
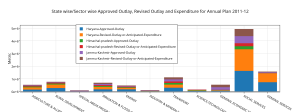
State wise/Sector wise Approved Outlay, Revised Outlay and Expenditure for Annual Plan 2011-12
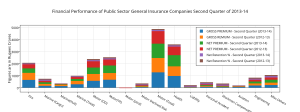
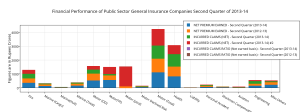
Financial Performance of Public Sector General Insurance Companies Second Quarter of 2013-14
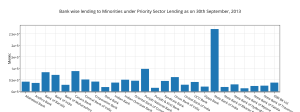
Bank wise lending to Minorities under Priority Sector Lending as on 30th September, 2013
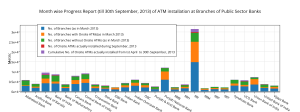
Month wise Progress Report (till 30th September, 2013) of ATM installation at Branches of Public Sector Banks
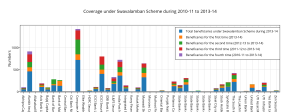
Coverage under Swavalamban Scheme during 2010-11 to 2013-14
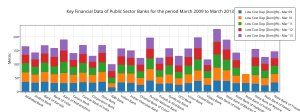
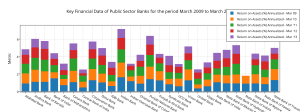
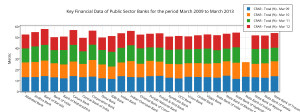
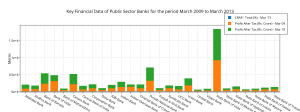
Key Financial Data of Public Sector Banks for the period March 2009 to March 2013
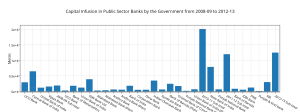
Capital Infusion in Public Sector Banks by the Government from 2008-09 to 2012-13
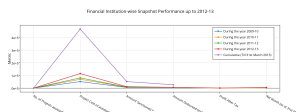
Financial Institution-wise Snapshot Performance up to 2012-13
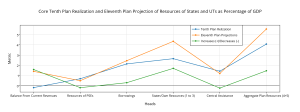
Core Tenth Plan Realization and Eleventh Plan Projection of Resources of States and UTs as Percentage of GDP
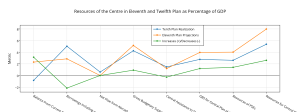
Resources of the Centre in Eleventh and Twelfth Plan as Percentage of GDP
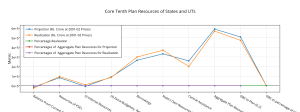
Core Tenth Plan Resources of States and Union Territories
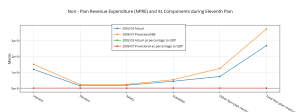
Non – Plan Revenue Expenditure (NPRE) and its Components during Eleventh Plan
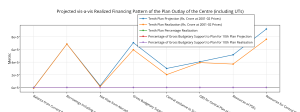
Projected vis-a-vis Realized Financing Pattern of the Plan Outlay of the Centre (including UTs)
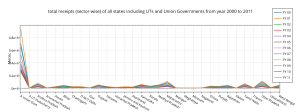
Total receipts (sector-wise) of all states including UTs and Union Governments from year 2000 to 2011
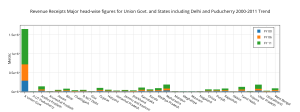
Revenue Receipts Major head-wise figures for Union Govt. and States including Delhi and Puducherry 2000-2011 Trend
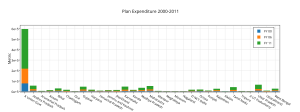
Plan Expenditure 2000-2011
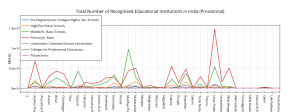
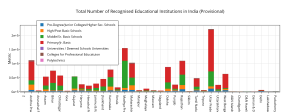
Total Number of Recognised Educational Institutions in India (Provisional)
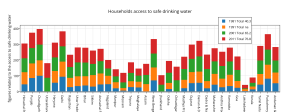
Households access to safe drinking water
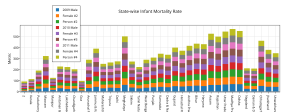
State-wise Infant Mortality Rate
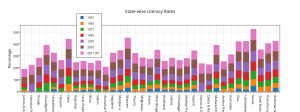
State-wise Literacy Rates
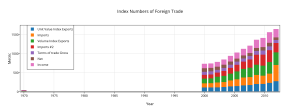
Index Numbers of Foreign Trade
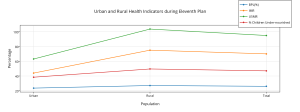
Urban and Rural Health Indicators during Eleventh Plan
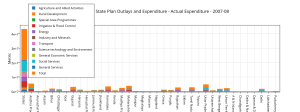
Sector-wise State Plan Outlays and Expenditure – Actual Expenditure – 2007-08
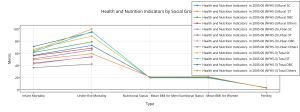
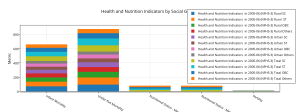
Health and Nutrition Indicators by Social Groups in 2005-06 (NFHS-3)
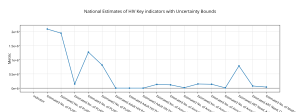
National Estimates of HIV Key indicators with Uncertainty Bounds
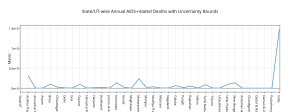
State/UT-wise Annual AIDS-related Deaths with Uncertainty Bounds
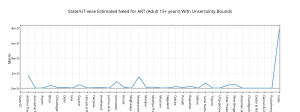
State/UT-wise Estimated Need for ART (Adult 15+ years) With Uncertainty Bounds
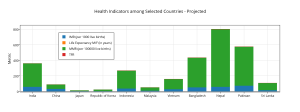
Health Indicators among Selected Countries – Projected
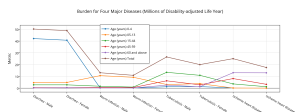
Burden for Four Major Diseases (Millions of Disability-adjusted Life Year)
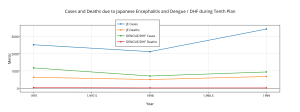
Cases and Deaths due to Japanese Encephalitis and Dengue / DHF during Tenth Plan
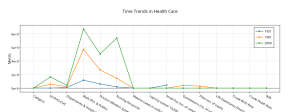
Time Trends in Health Care
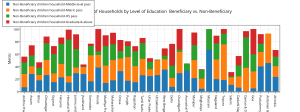
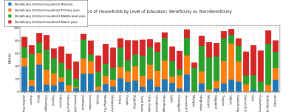
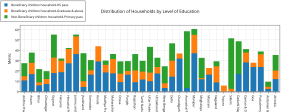
Distribution of Households by Level of Education Beneficiary vs. Non-Beneficiary
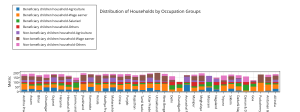
Distribution of Households by Occupation Groups Beneficiary vs. Non-Beneficiary
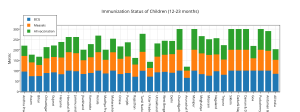
Immunization Status of Children (12-23 months)
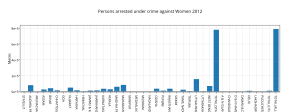
Persons arrested under crime against Women
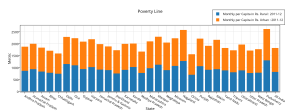
Poverty Line, 2011
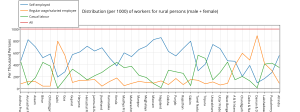
Distribution (per 1000) of workers for rural persons (male + female) according to usual status (taking both principal and subsidiary status together) by broad employment status for each State/UT
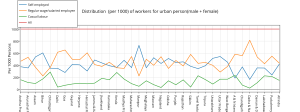
Distribution (per 1000) of workers for urban person(male + female) according to usual status (taking both principal and subsidiary status together) by broad employment status for each State/UT
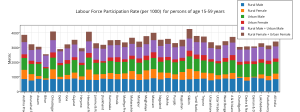
Labour Force Participation Rate (per 1000) for persons of age 15-59 years according to current weekly status approach for each State/UT
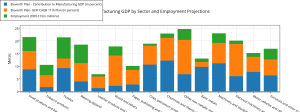
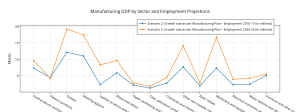
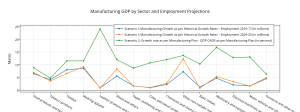
Manufacturing GDP by Sector and Employment Projections
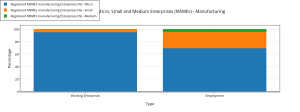
Registered Micro, Small and Medium Enterprises (MSMEs) – Manufacturing
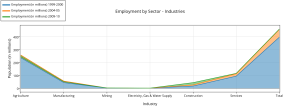
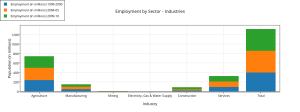
Employment by Sector – Industries
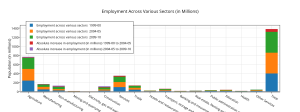
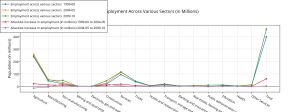
Employment Across Various Sectors (in Millions)
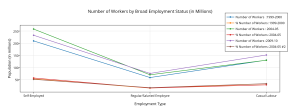
Number of Workers by Broad Employment Status (in Millions)
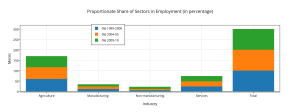
Proportionate Share of Sectors in Employment (in percentage)
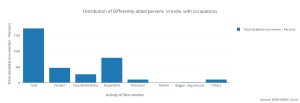
Distribution of Differently-abled persons in India, with occupations
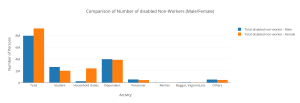
Comparison of Number of disabled Non-Workers (Male/Female)
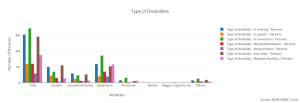
Types of Disabilities
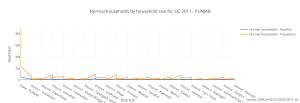
Normal households by household size for SC, 2011 – PUNJAB
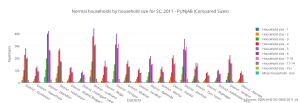
Normal households by household size for SC, 2011 – PUNJAB (Compared Sizes)
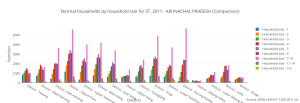
Normal households by household size for ST, 2011 – ARUNACHAL PRADESH (Comparison)
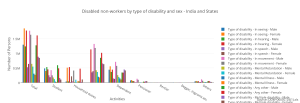
Disabled non-workers by type of disability and sex, 2011
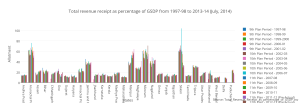
Total revenue receipt as percentage of GSDP from 1997-98 to 2013-14 (July, 2014)
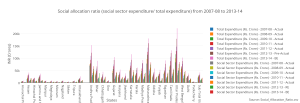
Social allocation ratio (social sector expenditure/ total expenditure) from 2007-08 to 2013-14
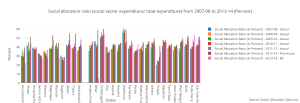
Social allocation ratio (social sector expenditure/ total expenditure) from 2007-08 to 2013-14 (Percent)
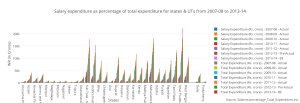
Salary expenditure as percentage of total expenditure for states & UTs from 2007-08 to 2013-14
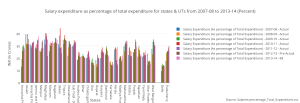
Salary expenditure as percentage of total expenditure for states & UTs from 2007-08 to 2013-14 (Percent)
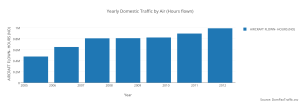
Yearly Domestic Traffic by Air (Hours flown)
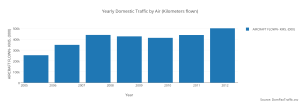
Yearly Domestic Traffic by Air (Kilometers flown)
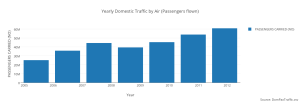
Yearly Domestic Traffic by Air (Passengers flown)
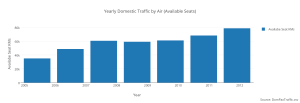
Yearly Domestic Traffic by Air (Available Seats)
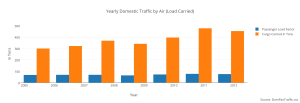
Yearly Domestic Traffic by Air (Load Carried)
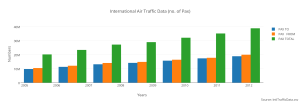
International Air Traffic Data (no. of Passengers)
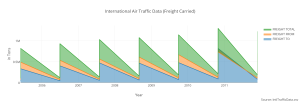
International Air Traffic Data (Freight Carried)
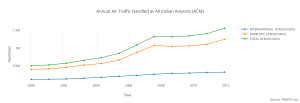
Annual Air Traffic Handled at All Indian Airports (ACM)
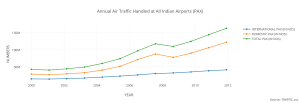
Annual Air Traffic Handled at All Indian Airports (Passengers)
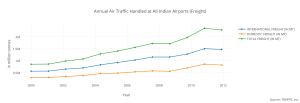
Annual Air Traffic Handled at All Indian Airports (Freight)
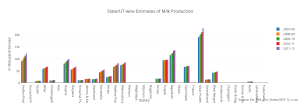
State/UT-wise Estimates of Milk Production
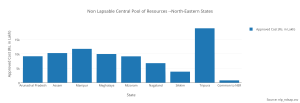
Non Lapsable Central Pool of Resources –North-Eastern States
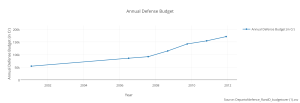
Annual Defense Budget
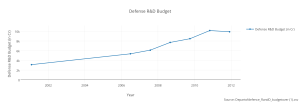
Defense R&D Budget
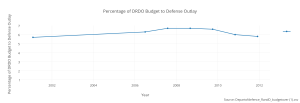
Percentage of DRDO Budget to Defense Outlay
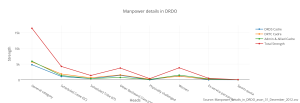
Manpower details in DRDO
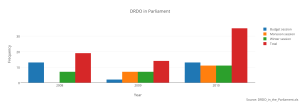
DRDO in Parliament
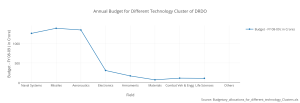
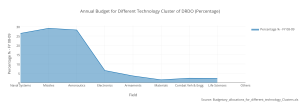
Annual Budget for Different Technology Cluster of DRDO
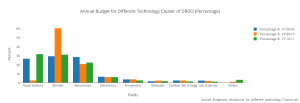
Annual Budget for Different Technology Cluster of DRDO (Percentage)
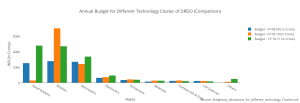
Annual Budget for Different Technology Cluster of DRDO (Comparison)
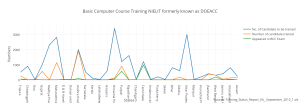
Basic Computer Course Training NIELIT formerly known as DOEACC
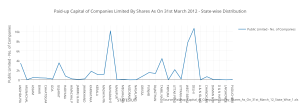
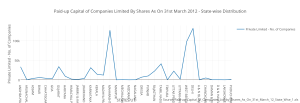
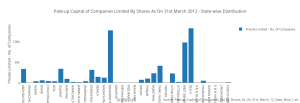
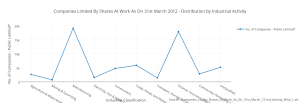
Paid-up Capital of Companies Limited By Shares As On 31st March 2012 – State-wise Distribution
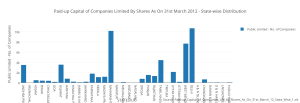
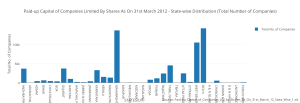
Paid-up Capital of Companies Limited By Shares As On 31st March 2012 – State-wise Distribution (Total Number of Companies)
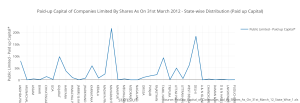
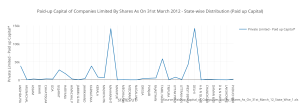
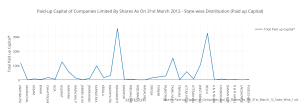
Total Paid-up Capital of Companies Limited By Shares As On 31st March 2012 – State-wise Distribution (Paid up Capital)
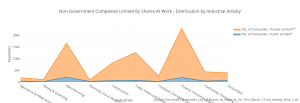
Non-Government Companies Limited By Shares At Work – Distribution by Industrial Activity
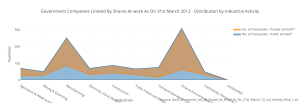
Government Companies Limited By Shares At work As On 31st March 2012 – Distribution by Industrial Activity
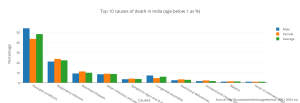
Top 10 causes of death in India (age below 1 as %)
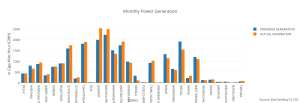
Monthly Power Generation
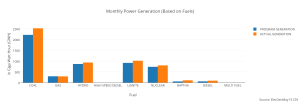
Monthly Power Generation (Based on Fuels)
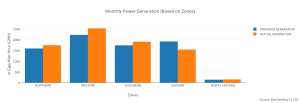
Monthly Power Generation (Based on Zones)
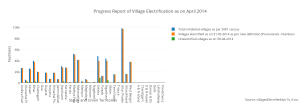
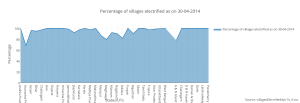
Progress Report of Village Electrification as on April 2014
Percentage of villages electrified as on 30-04-2014
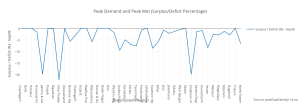
Peak Demand and Peak Met (Surplus/Deficit Percentage)
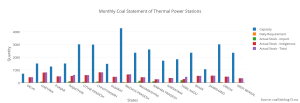
Monthly Coal Statement of Thermal Power Stations
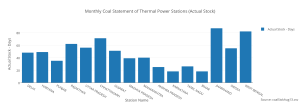
Monthly Coal Statement of Thermal Power Stations (Actual Stock)
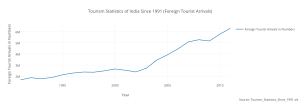
Tourism Statistics of India Since 1991 (Foreign Tourist Arrivals)
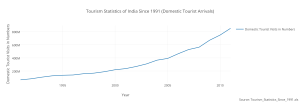
Tourism Statistics of India Since 1991 (Domestic Tourist Arrivals)
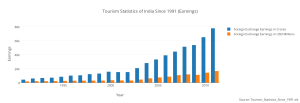
Tourism Statistics of India Since 1991 (Earnings)
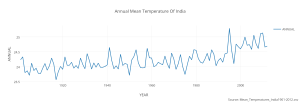
Annual Mean Temperature Of India
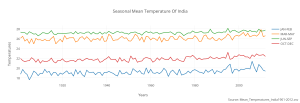
Seasonal Mean Temperature Of India
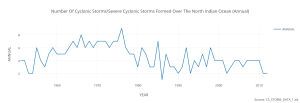
Number Of Cyclonic Storms/Severe Cyclonic Storms Formed Over The North Indian Ocean (Annual)
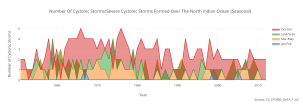
Number Of Cyclonic Storms/Severe Cyclonic Storms Formed Over The North Indian Ocean (Seasonal)
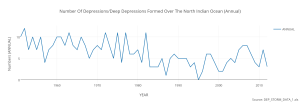
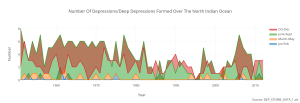
Number Of Depressions/Deep Depressions Formed Over The North Indian Ocean (Annual)
Number Of Depressions/Deep Depressions Formed Over The North Indian Ocean
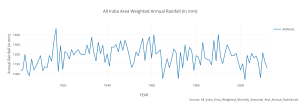
All India Area Weighted Annual Rainfall (in mm)
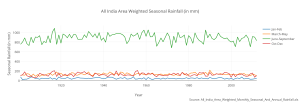
All India Area Weighted Seasonal Rainfall (in mm)
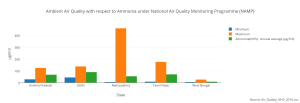
Ambient Air Quality with respect to Ammonia under National Air Quality Monitoring Programme (NAMP)
Ambient Air Quality with respect to Ammonia under National Air Quality Monitoring Programme (NAMP) (Percentile Plot)
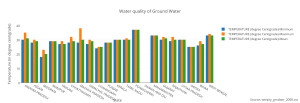
Water quality of Ground Water
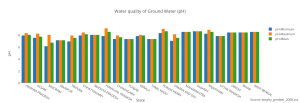
Water quality of Ground Water (pH)
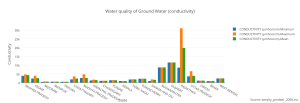
Water quality of Ground Water (conductivity)
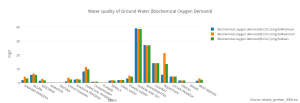
Water quality of Ground Water (Biochemical Oxygen Demand)
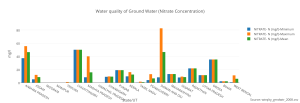
Water quality of Ground Water (Nitrate Concentration)
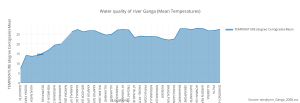
Water quality of river Ganga (Mean Temperatures)
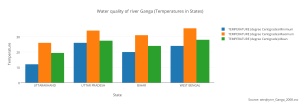
Water quality of river Ganga (Temperatures in States)
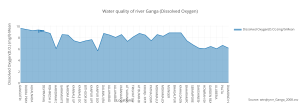
Water quality of river Ganga (Dissolved Oxygen)
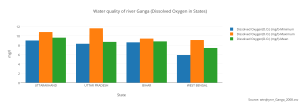
Water quality of river Ganga (Dissolved Oxygen in States)
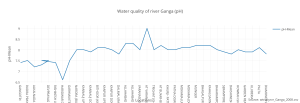
Water quality of river Ganga (pH)
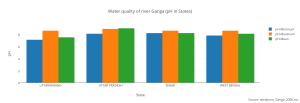
Water quality of river Ganga (pH in States)
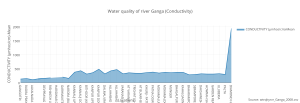
Water quality of river Ganga (Conductivity)
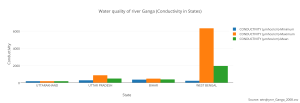
Water quality of river Ganga (Conductivity in States)
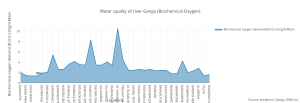
Water quality of river Ganga (Biochemical Oxygen)
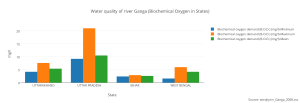
Water quality of river Ganga (Biochemical Oxygen in States)
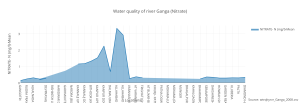
Water quality of river Ganga (Nitrate)
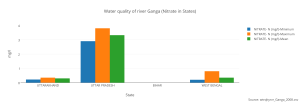
Water quality of river Ganga (Nitrate in States)
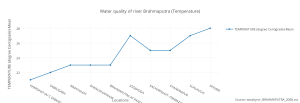
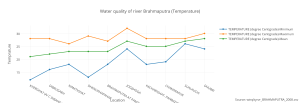
Water quality of river Brahmaputra (Temperature)
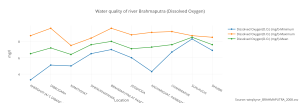
Water quality of river Brahmaputra (Dissolved Oxygen)
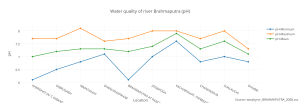
Water quality of river Brahmaputra (pH)
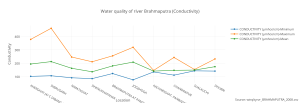
Water quality of river Brahmaputra (Conductivity)
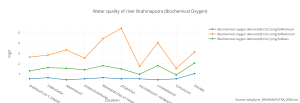
Water quality of river Brahmaputra (Biochemical Oxygen)
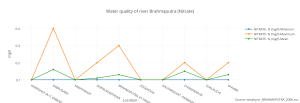
Water quality of river Brahmaputra (Nitrate)
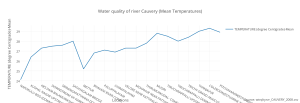
Water quality of river Cauvery (Mean Temperatures)
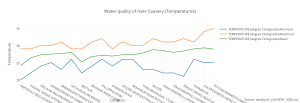
Water quality of river Cauvery (Temperatures)
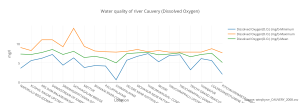
Water quality of river Cauvery (Dissolved Oxygen)
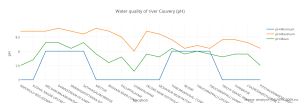
Water quality of river Cauvery (pH)
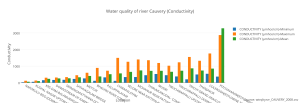
Water quality of river Cauvery (Conductivity)
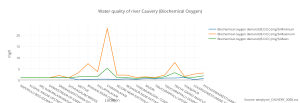
Water quality of river Cauvery (Biochemical Oxygen)
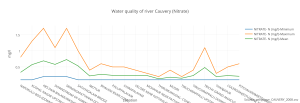
Water quality of river Cauvery (Nitrate)
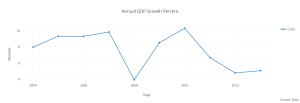
Annual GDP Growth Percent (Data Source: the World Bank)
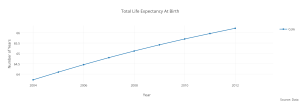
Total Life Expectancy At Birth (Data Source: the World Bank)
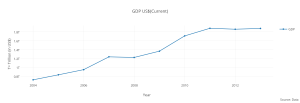
GDP US$(Current) (Data Source: the World Bank)
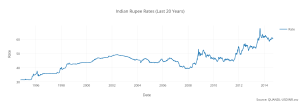
Indian Rupee Rates (Last 20 Years)
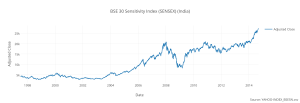
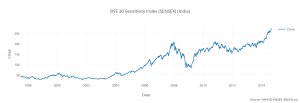
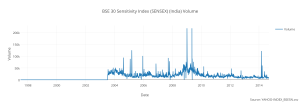
BSE 30 Sensitivity Index (SENSEX) (India)
Adjusted Close
Volume
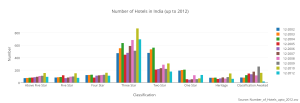
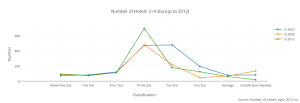
Number of Hotels in India (up to 2012)
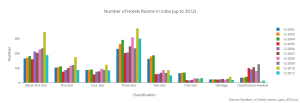
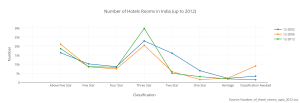
Number of Hotels Rooms in India (up to 2012)
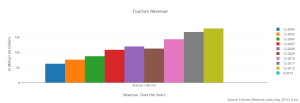
Tourism Revenue
