
Whilst Lucy and I were traveling in India, we met Gautam John at an Open Data meet-up in Bangalore. Following this initial meeting, Gautam’s colleague Megha Vishwanath has written this post for the Open Data India blog, which explains the Karnataka Learning Partnership project, in which open data is being collected, aggregated and deployed to make a difference to schooling in one region of India.
What is the Karnataka Learning Partnership?
KLP: The Karnataka Learning Partnership was formed as a framework for nonprofits, corporations, academic institutions, and citizens to get involved in improving government schools in Karnataka, India. The idea was seeded by Akshara Foundation’s extensive work in government-run schools and preschools in the state. KLP’s work has touched thousands of children. KLP aims at being an independent platform for data collation, visualisation, sharing and data-driven advocacy in Public education.
The Background to Public Education in Karnataka
The Education Development Index (EDI), a ranking conducted by the National University of Educational Planning and Administration (NUEPA), has been developed keeping in mind four broad parameters – access, infrastructure, teacher-related indicators and outcomes. The index takes into account availability of schools, the average pupil-to-teacher ratio, the availability of drinking water facilities and the availability of toilets for girls and boys.
In 2011, Karnataka had slipped four positions to be ranked 16th in the annual rating of 35 states. Karnataka ranked 23 and 24 in the infrastructure index for primary schools and upper primary schools respectively. Infrastructure issues seem to have a domino effect on the functioning of a school – creating a learning environment that isn’t conducive to learning, a shortage of classrooms, no playgrounds, apathy towards nutrition and hygiene, teacher absenteeism, indifference from parents, dysfunctional School Development and Monitoring Committees (SDMCs) and hence, as expected, poor learning outcomes.
Elected Representatives: An Opportunity to bring them the Data
Indian Governments are also shrouded by issues of multi-crore scams, the mammoth-bureaucracy, red tape, corruption, nepotism and political struggles among incompetent parties. The elected representatives reclaim their voter base through antics of provisioning for basic needs of communities in their electoral regions. The issue of failing infrastructure in public schools is often an opportunity for an MP / MLA to regain the confidence of the voter community comprising of parents and teachers.
At KLP, we see this as an opportunity to make available to the MPs/ MLAs information on the status of public schools and preschools in their constituencies. Thus a well focussed effort in terms of budgetary allocations and improvement of the local public school can be facilitated over our platform.
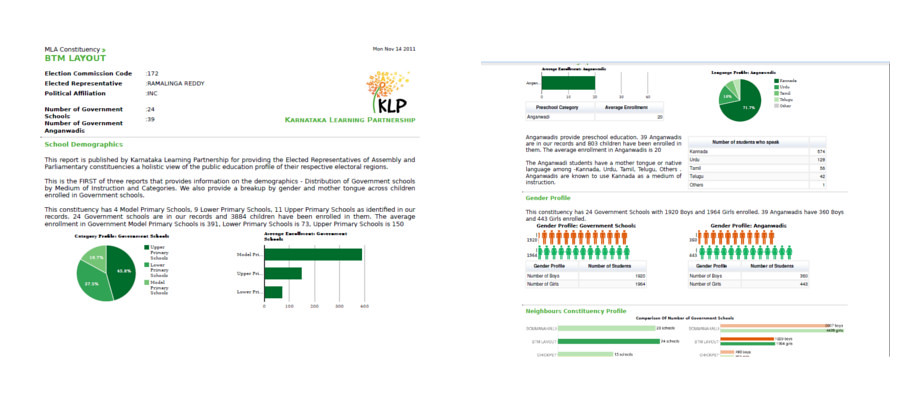
Published Reports
In the past academic year , KLP published 3 reports. These offered an an overview on:
The demographics of Government schools and preschools
- Total number of schools , preschools, a break up of schools by category and medium of instruction
- Total number children enrolled in these institutions with gender ratios, a break up by mother tongue
Financial allocations to Government schools
- based on category of school
- number of classrooms
- number of teachers
Infrastructure of Government schools and preschools under the broad headings of
- basic infrastructure
- nutrition and hygiene
- community involvement
- learning environment
- toilets
The reports were based on aggregated data for Bangalore and for MPs and MLAs only. They were made available in Kannada (the local official language) and English.
The basic information for a Government school / preschool and the MP and MLA linkages per school is available as raw csv download on the website. Any additional information per school or preschool either from KLP’s database or the DISE database can be provided quickly on request.
Data Sources
KLP: Akshara Foundation’s long standing relationship with schools and preschools forms the large chunk of school and child information (gender and mother tongue) that has been gathered over the last decade through programmes and interventions. The data collected, cleaned and recorded feeds KLP’s public database. For every school / preschool, at a minimum, we have category, medium of instruction and DISE code (a unique identifier by which the Education Department publishes data). Additionally for all schools in Bangalore we have addresses, geo location and photo identifiers. For this exercise of reporting, Akshara’s field staff mapped an MP constituency, MLA constituency and Ward name for every school and preschool in Bangalore.
NUEPA – DISE: District Information System for Education’ (DISE) is a public database providing comprehensive information on Government schools across India as part of a school monitoring framework. Year on year, the database is updated and information on – basic identifiers, about teachers, compliance with Right to Education, enrollment, financial allocation, school facilities – per school is published for public consumption on the DISE website. It is a popular source for media and other organisations to report on Education.
Election Commission & Other sources: The election commission and several other miscellaneous sources, including the Bangalore Metropolitan Corporation (BBMP – Bruhat Bengaluru Mahanagara Palike) publish and keep updated information on valid constituencies and wards, current elected representative, his / her political affiliation, offices and addresses. Some geolocation data is available on the Election Commission website, that needs to be validated. The websites for the Election Commision and BBMP were scraped to build up a database of electoral regions with their IDs mapped to Government schools and preschools in the respective electoral region.
Cleaning the Data & Assuring Quality
Large amounts of data are likely to need some tolerance to error. The first aggregated views for number of Government schools for an MLA constituency gave us hugely unlikely and erroneous numbers for some constituencies. The exercise of collecting MP and MLA information for preschools and schools were repeated several times by Akshara’s field staff until the numbers seemed acceptable, and until we had a mapping for every known Government school and preschool in Bangalore.
The KLP database was validated for basic school information against DISE and this exercise helped us ensure we reference each school in our database against the right DISE code (the department’s unique identifier). A small percentage of the school information in DISE was erroneous while some of it was outdated. KLP’s team has manually verified close to 300/400 records, where all programmatic comparisons failed, only to make sure we reduce the chances of error.
Reports & Outcomes
Here’s a link to all the reports published thus far. We thank our Visualisation experts – Anand S and Rahul Gonsalves for consulting with us pro bono in making these reports meaningful.
The feedback of our Elected Representatives to these reports has been overwhelming. From “wanting to make mine a Model Constituency” to “please keep me informed about the problems in my area”, such positive responses keep us motivated to publish information aggregated in a way that is meaningful and makes an impact.
Here’s a link to Akshara Foundation’s write up on the Akshara-KLP team’s experiences in delivering these reports : An Interaction with the Elected Representatives
Technology
The underlying reporting engine is a python – web.py based web app reading from a Postgres database that brings in views from the multiple data sources. Python scripts were written for all data scraping, data base creation and cleanup processes. Charting libraries used are from Google Visualization. The report is an HTML5 web page that is styled with CSS and printed off the browser in high quality.
Unicode compliance, to be able to produce a bilingual report was key to this design. The current code repository is on Github
To Dos:
We will be reporting, particularly on Library Infrastructure and Learning Outcomes in these constituencies. We need these reports to be able to drill down to the Corporator / Ward level so they have better reach and are much more actionable.
We need in terms of a tech stack a rigourous reporting tool that seamlessly integrates with unicode, print formats / styling and can zoom in and zoom out on the aggregated data based on a selection of geography.
We intend to integrate these reports, if shapes files and proper geocodes be available for all these constituencies on our map page.
There’s a lot of work ahead of us though these are seemingly simple wants/needs. We invite programming and visualisation enthusiasts to help us do this task better.
Welcome all constructive criticism and inputs from the data communities at dev@klp.org.in